
Equity
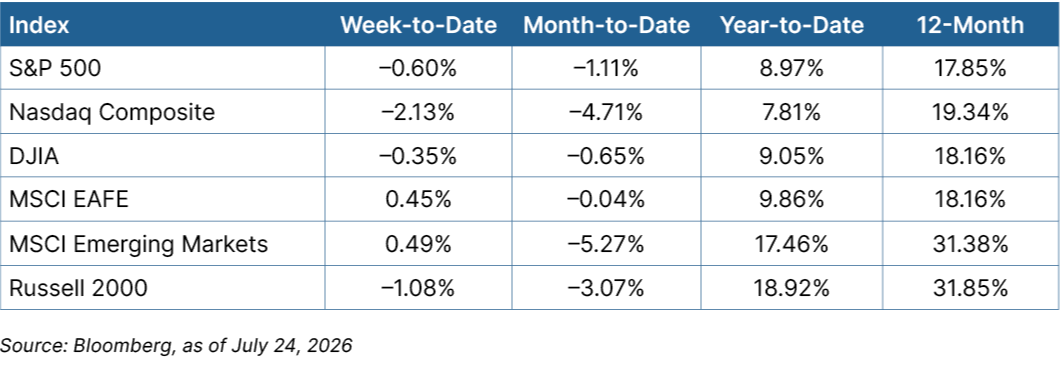
Markets closed lower in the U.S. The declines were led by a roughly 2 percent decline in the Nasdaq Composite and a 1 percent drop in the Russell 2000. The losses were concentrated in two sectors: communication services and consumer discretionary, which each fell more than 6 percent. Eight sectors had positive returns, however, indicating a strong underlying market. With crude oil prices rising nearly 13 percent, the energy sector rallied almost 4 percent. International markets bucked the trend and rose marginally.
Fixed Income
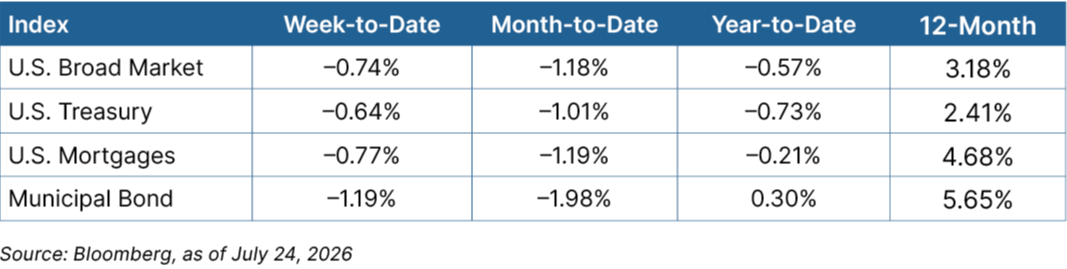
Rising oil prices led to higher rates, which pressured fixed income returns. Yields on the 10-year Treasury briefly traded above 4.7 percent for the first time in 18 months, ending the week at 4.68 percent. Core bonds, Treasuries, and mortgages dropped 0.5 percent to 0.75 percent. Municipal markets declined roughly 1 percent.

Looking Ahead
It will be a busy week that includes economic reports, high-profile earnings, and the Federal Open Market Committee’s (FOMC’s) July decision on interest rates.
- The week kicks off Monday with the advance durable goods orders report for June. Orders are expected to rebound after a transportation sector–led decline in May.
- On Tuesday, we’ll see the Conference Board Consumer Confidence Index for July. Expectations are for a slight improvement in confidence.
- The FOMC interest rate decision for July will be announced on Wednesday. Despite rising inflation, the committee is expected to leave rates unchanged
- On Thursday, we’ll see the advance estimate of GDP for the second quarter, along with personal income and spending reports for June.
- Lastly, many companies will report second-quarter earnings, including Microsoft, Meta Platforms, Apple, and Amazon.